


July 1st, 2025By Kaisa Vaittinen / Yh Training Review by YH Training: Meet Eurekos LMS – the number one Just as selecting an ERP system

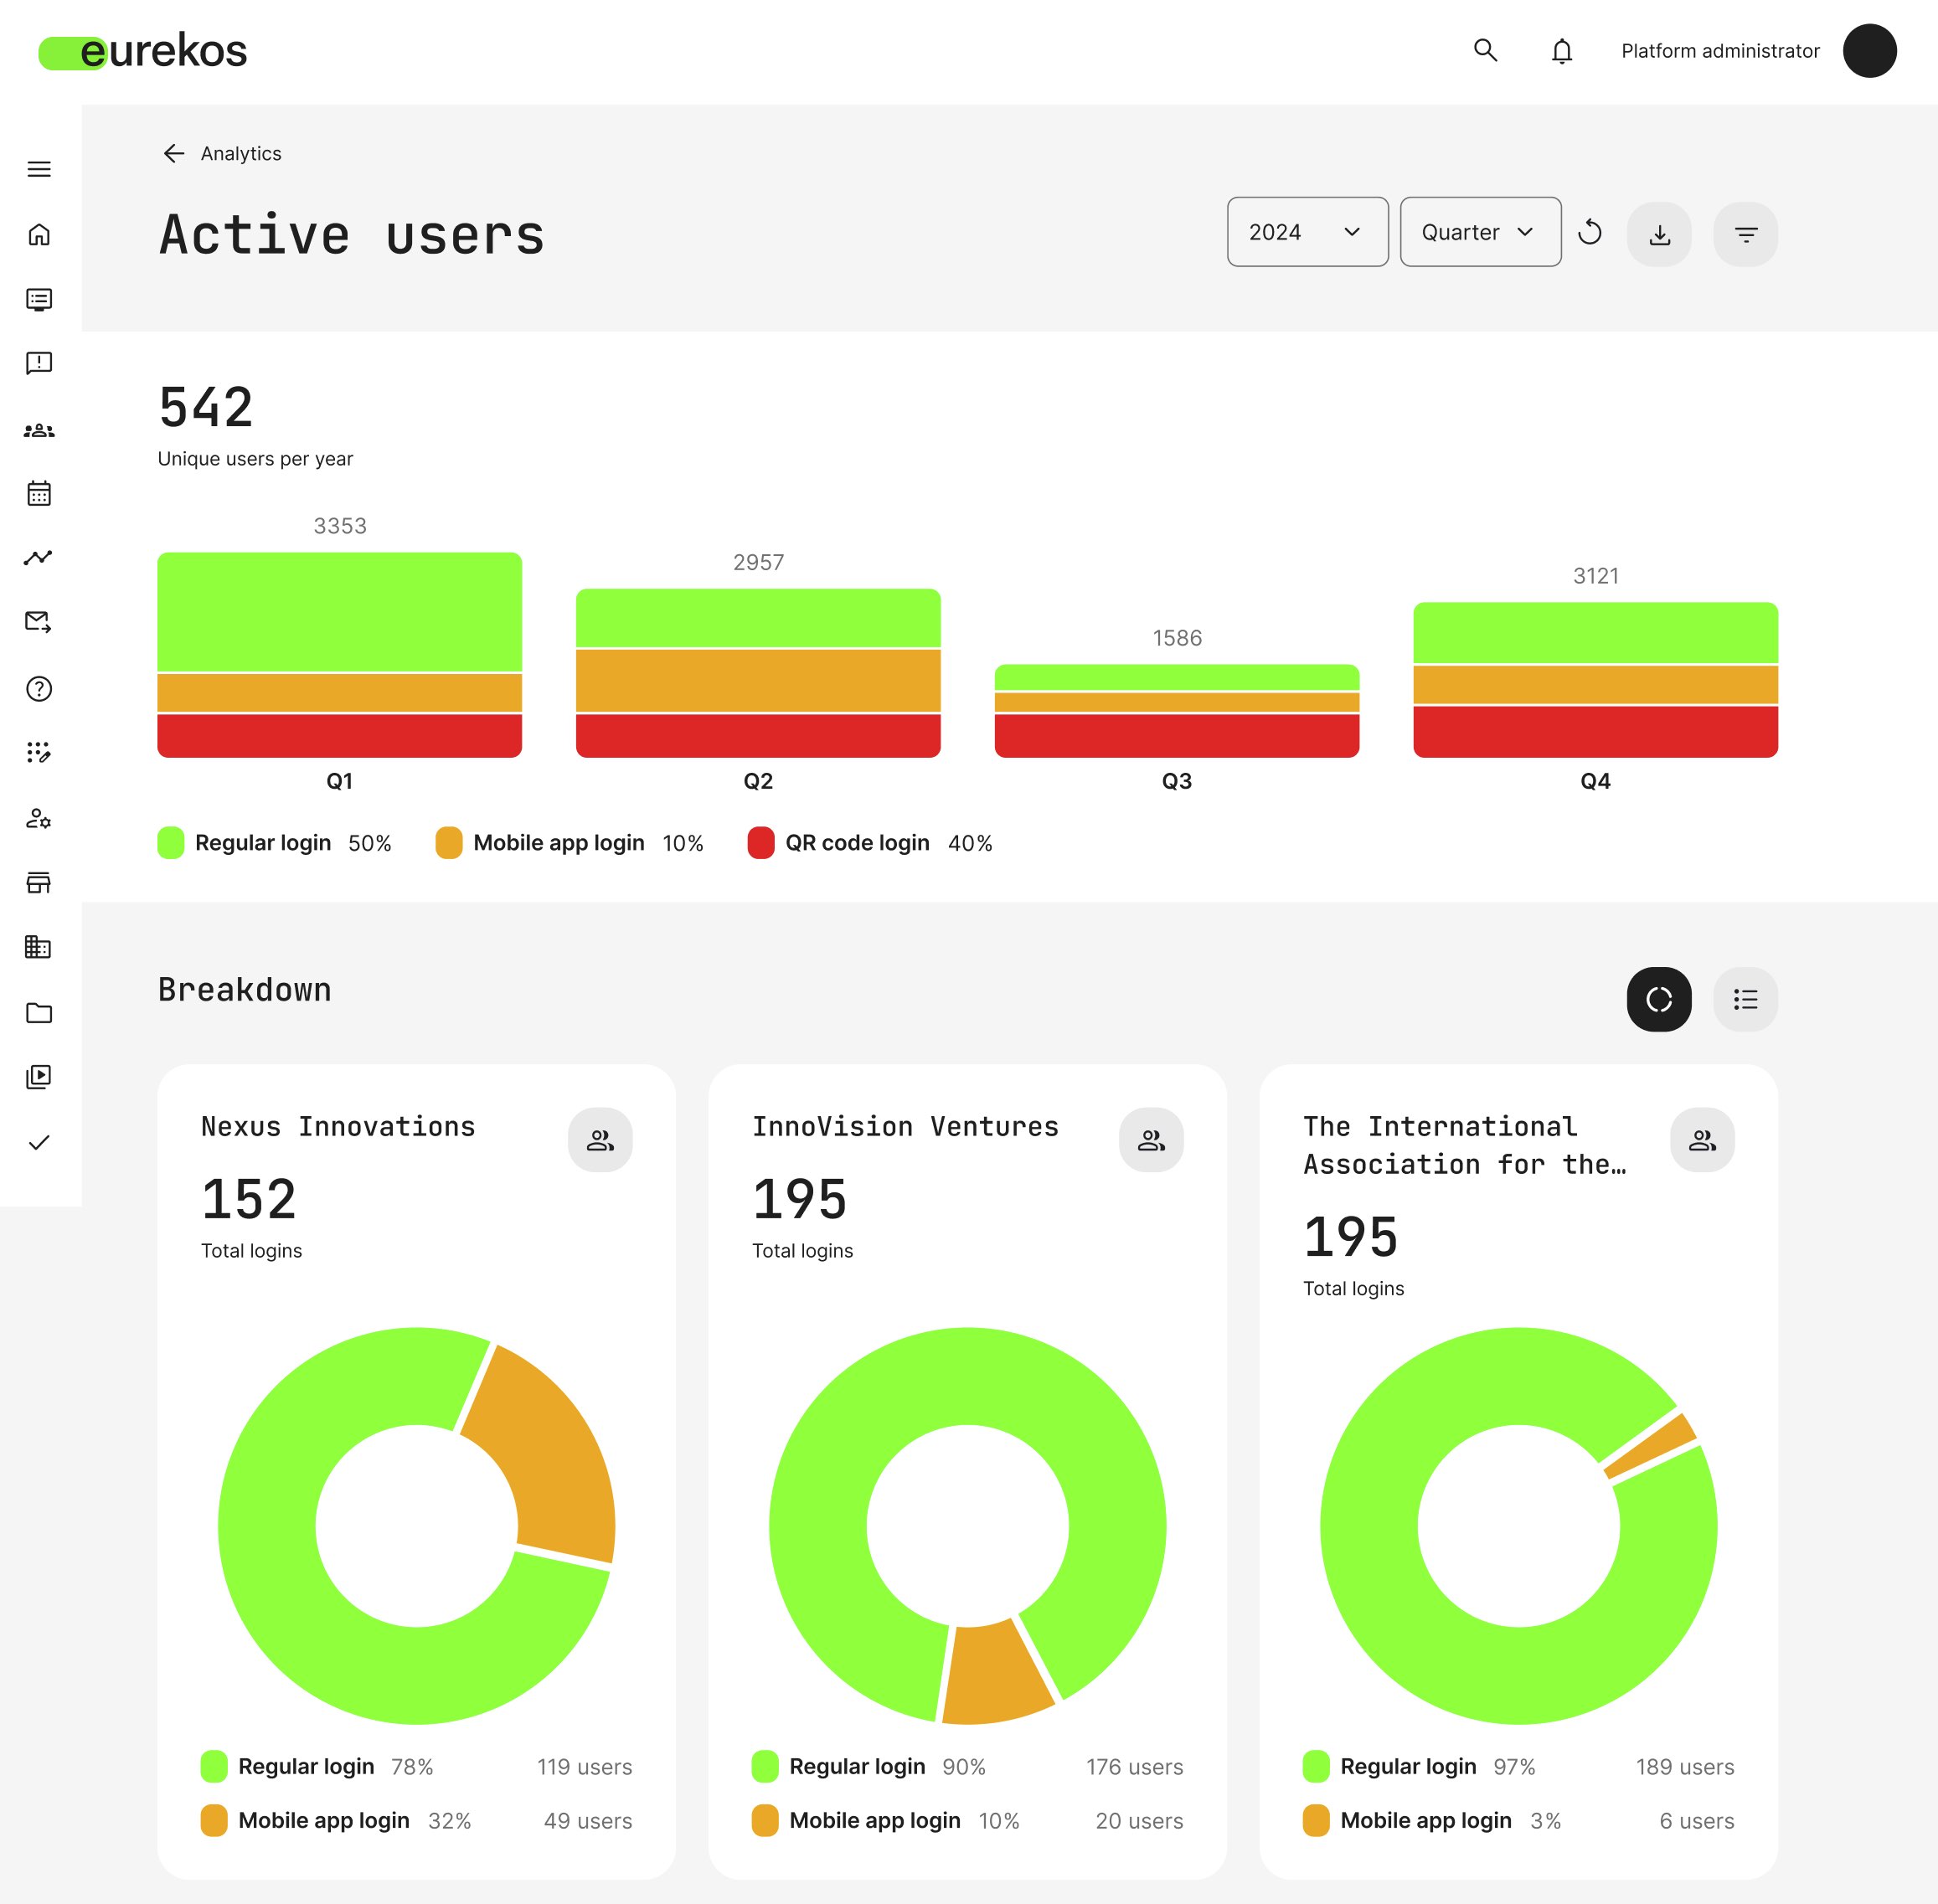
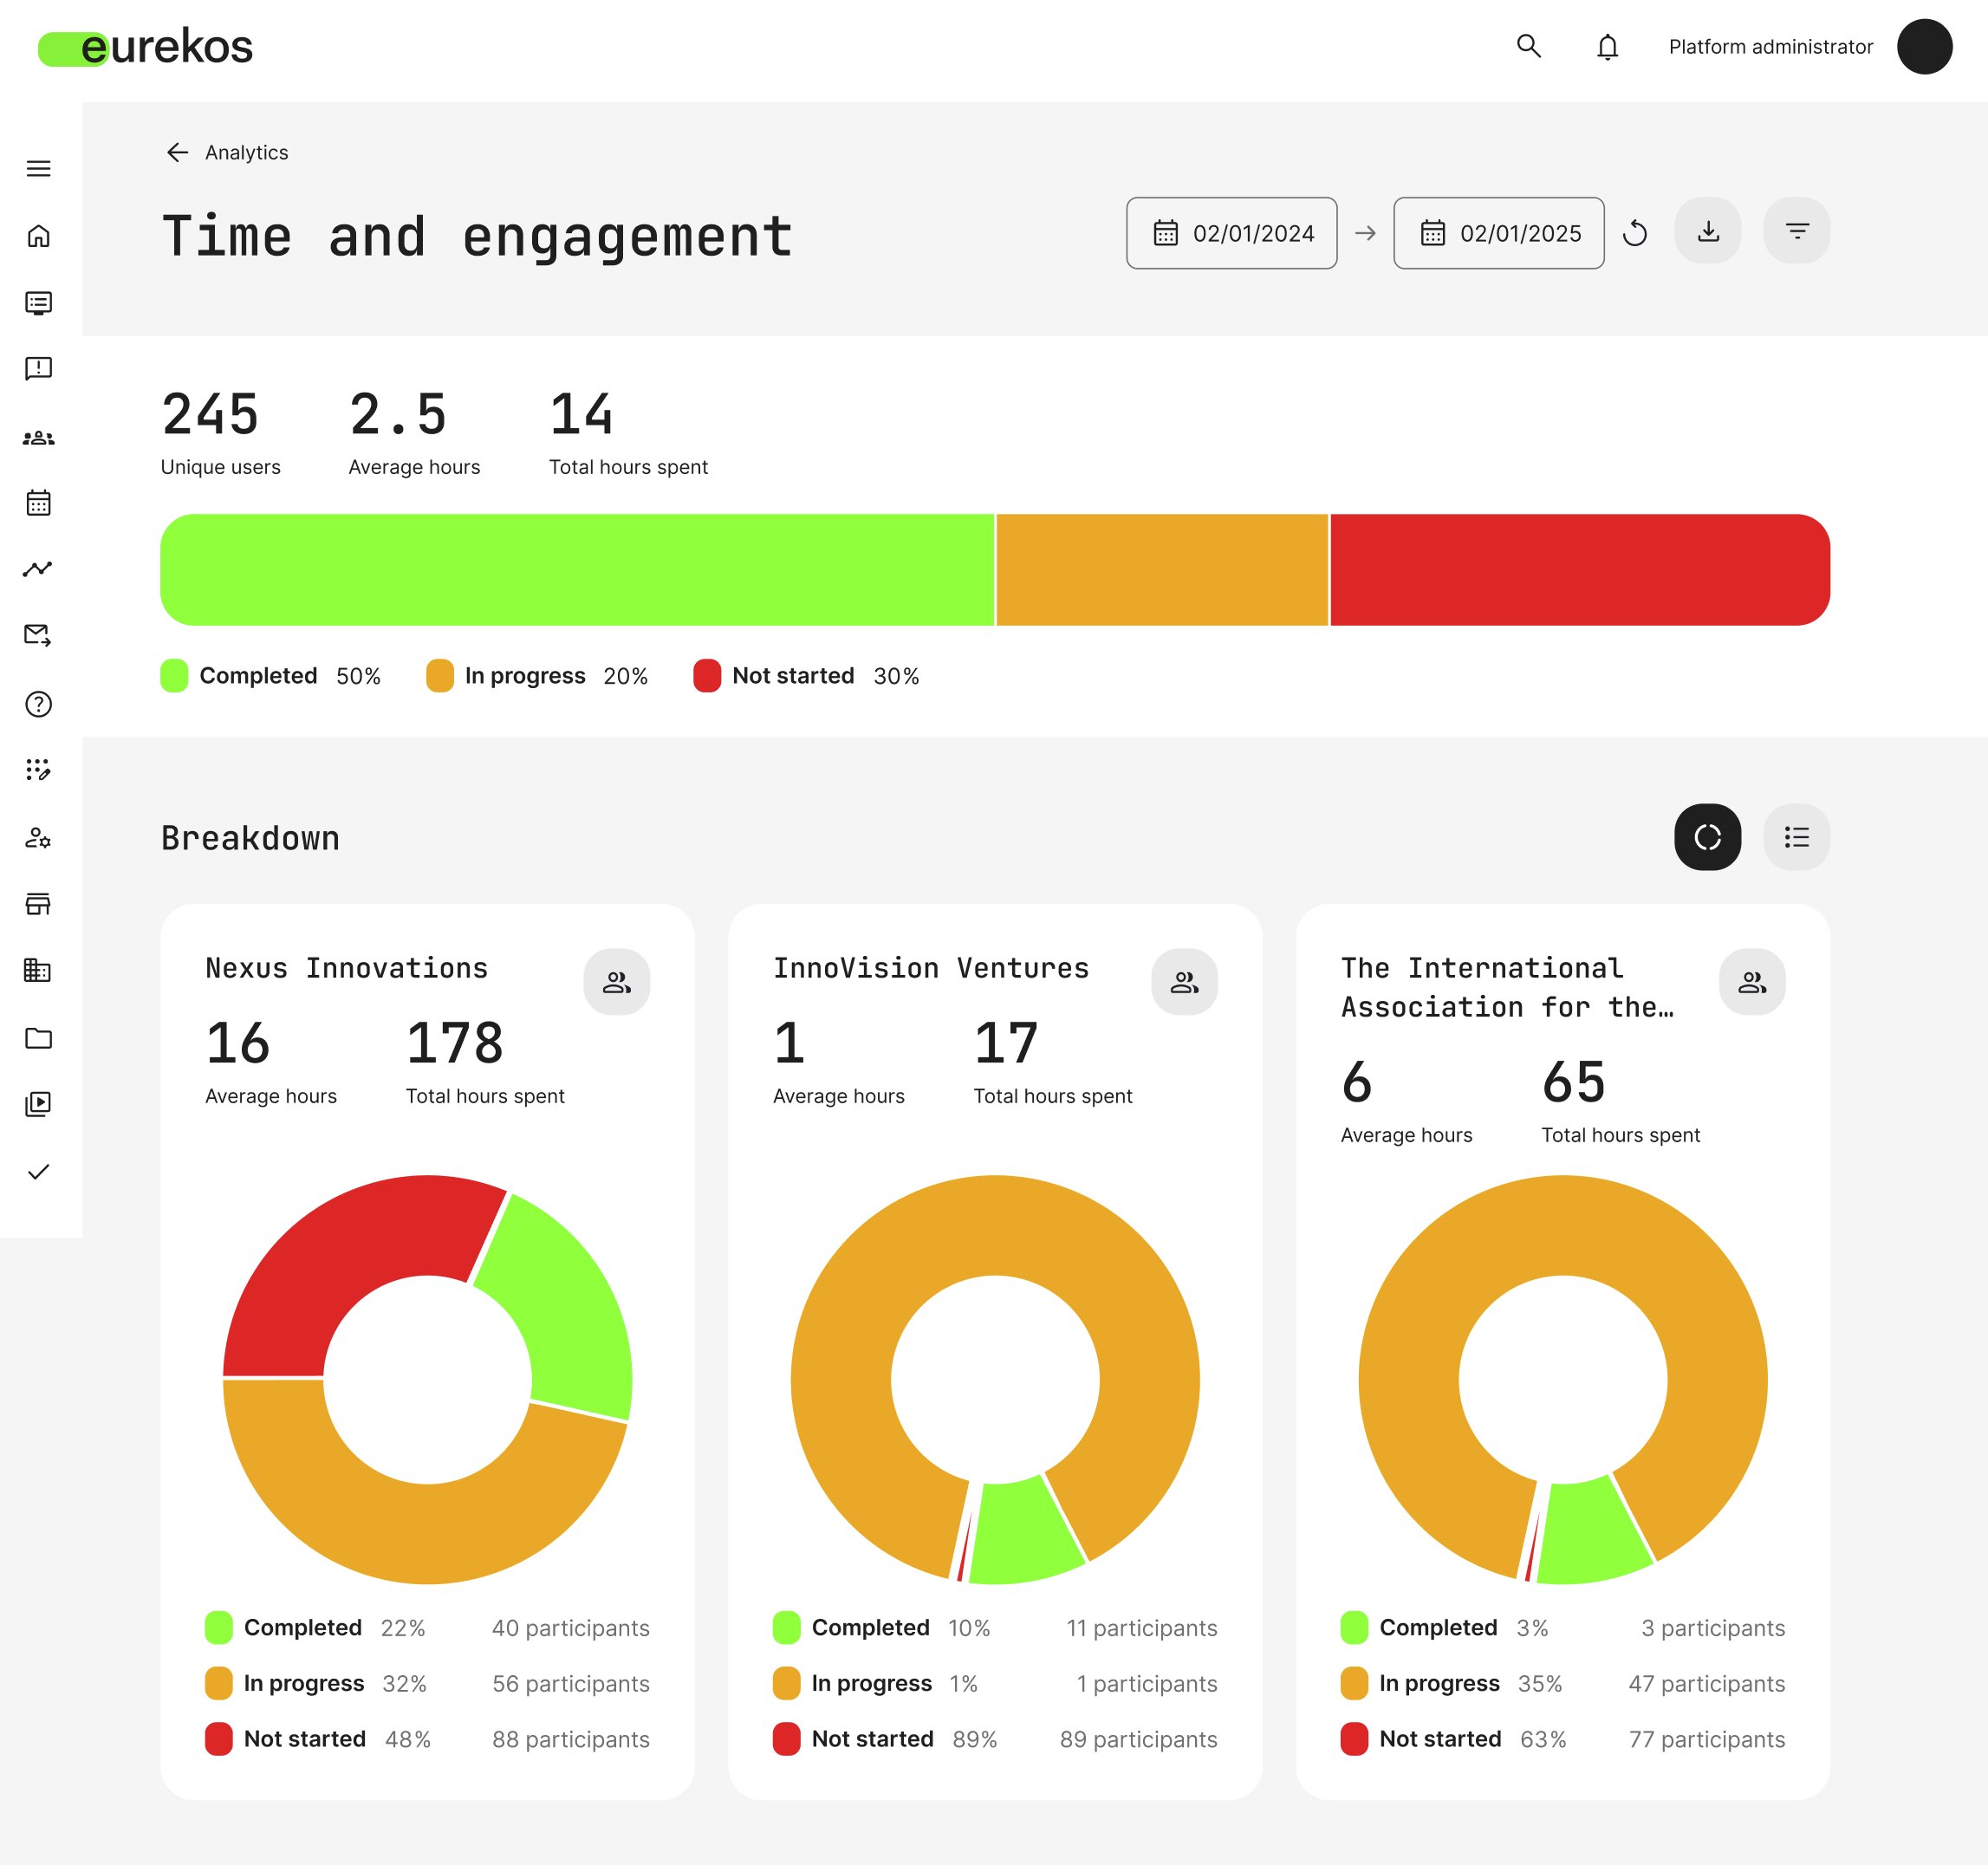
By Eurekos Systems New Feature: Explore Our Updated Dashboards Welcome to The Eurekos Effect, where we highlight the latest updates designed to make your learning
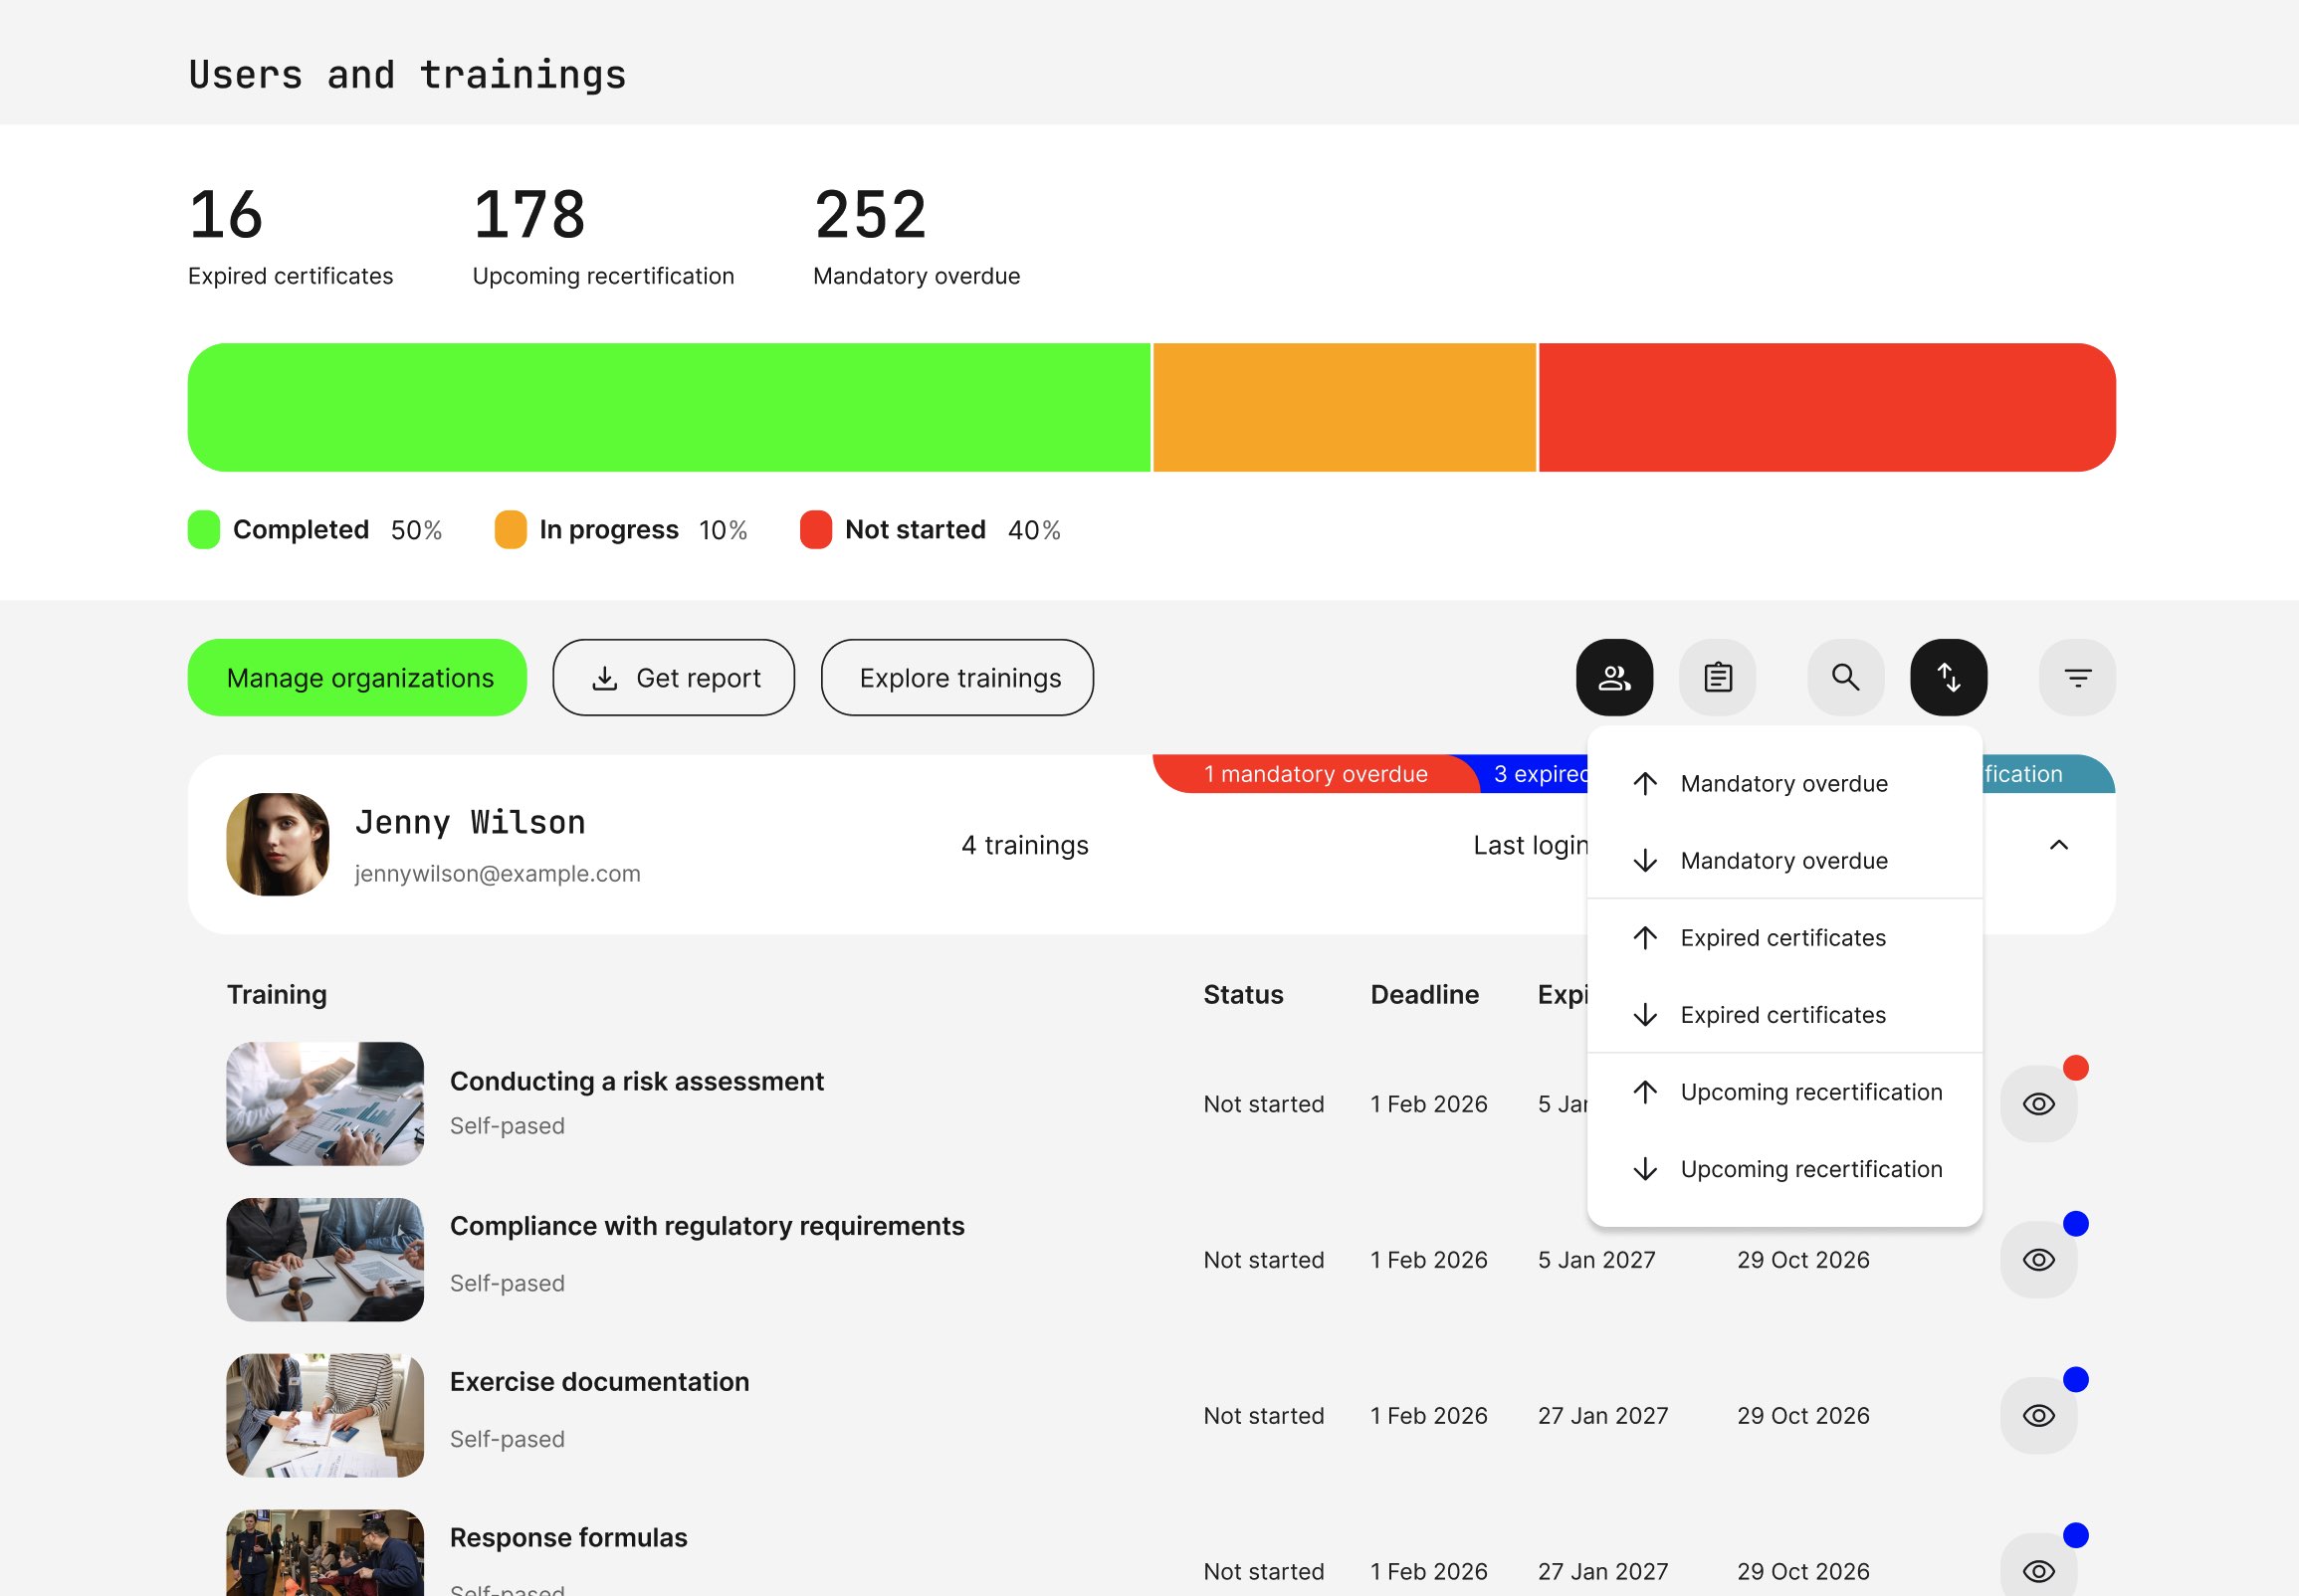
By Eurekos Systems New Feature: Analytics Permissions for Secure, Role-Based Access Welcome to The Eurekos Effect, where we highlight the latest updates designed to make
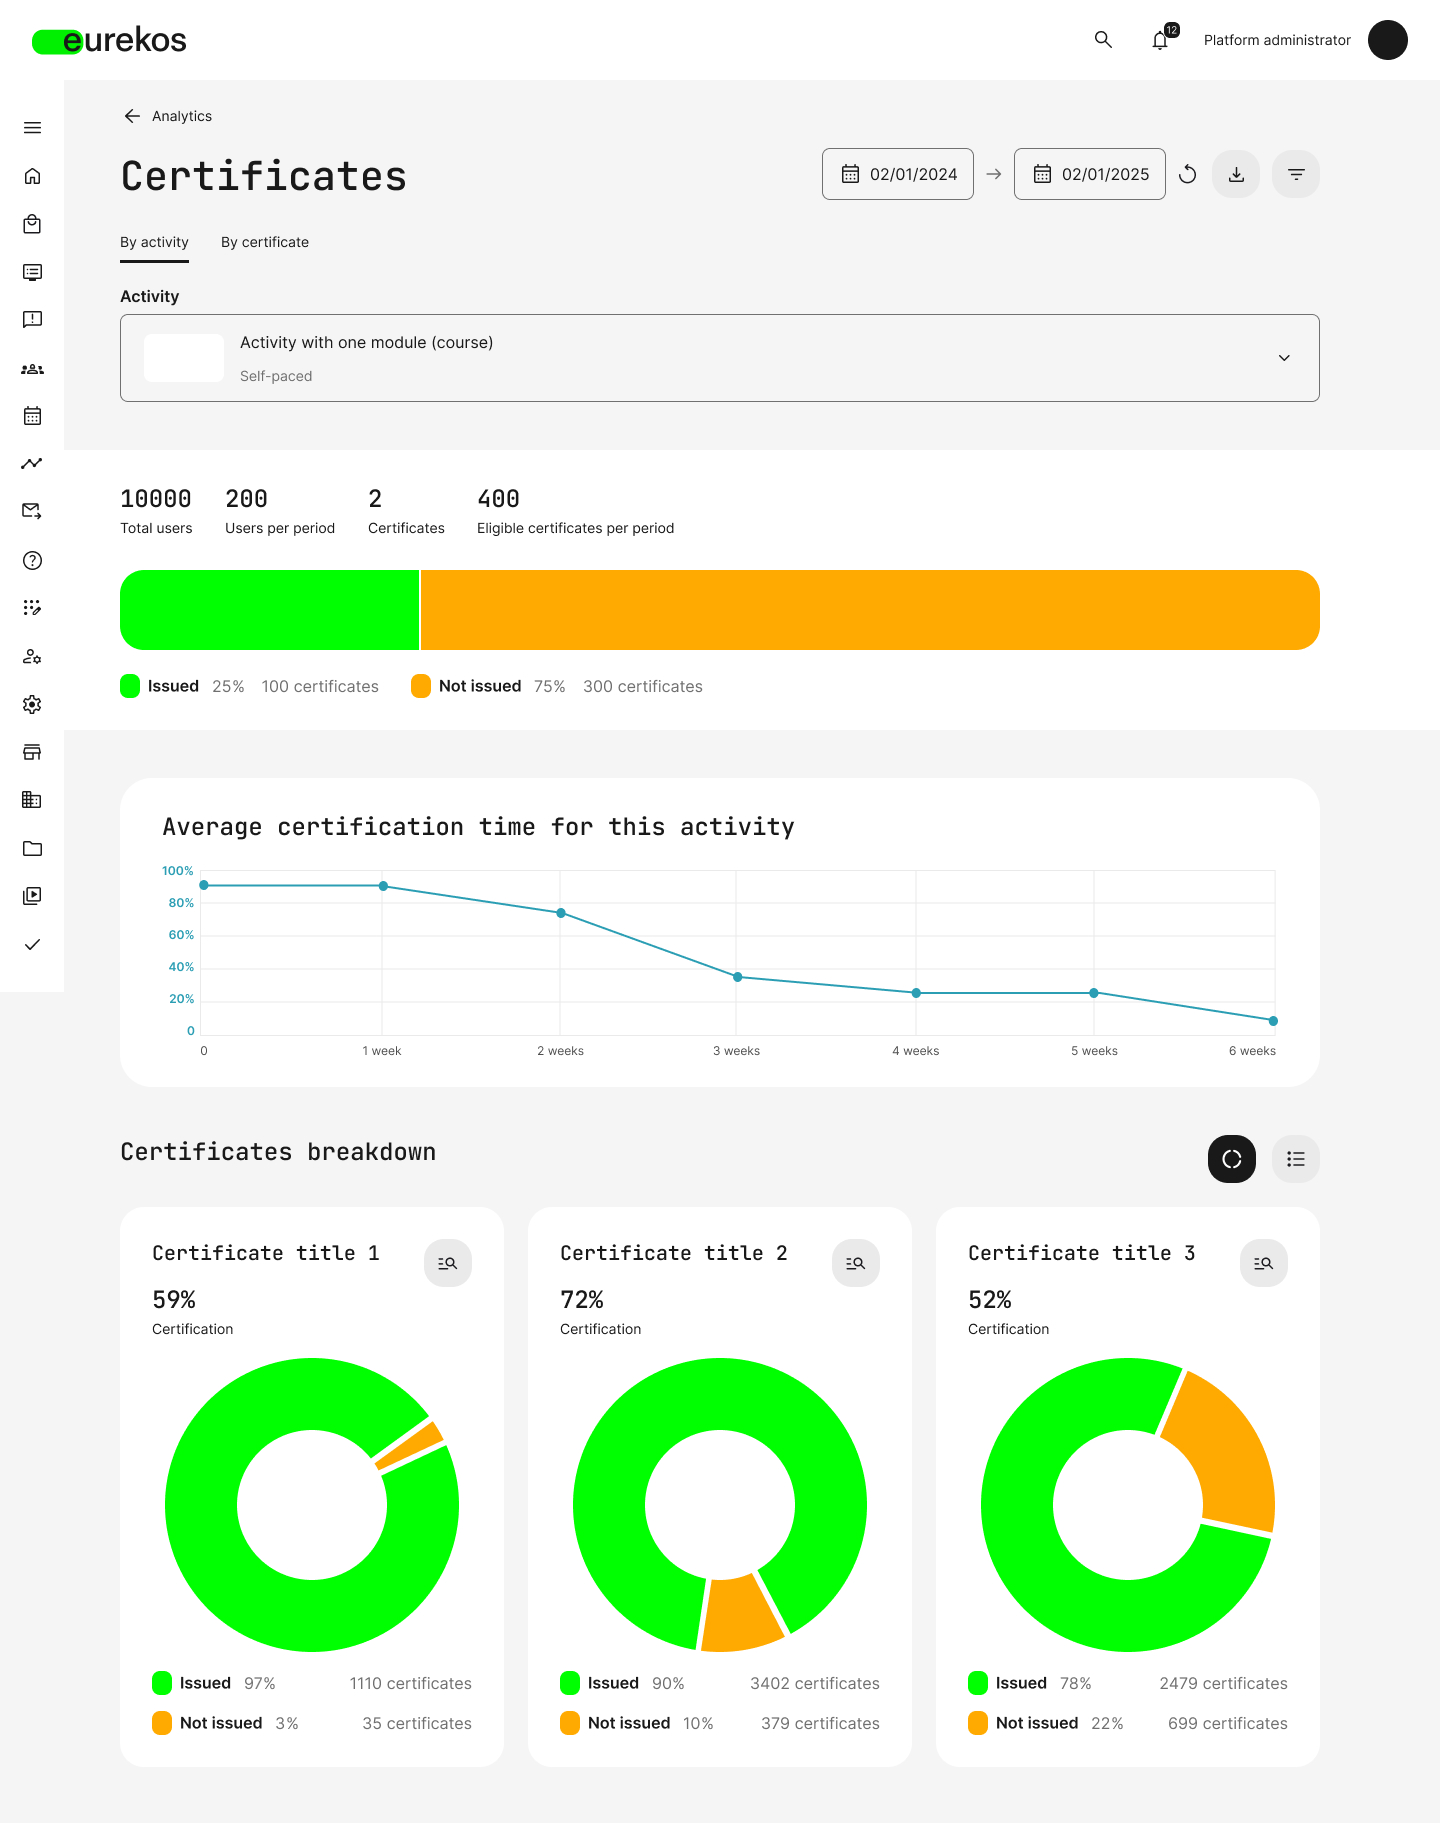
By Eurekos Systems New Feature: Visual dashboards for Smarter Learning Insights Welcome to The Eurekos Effect, where we highlight the latest updates designed to make
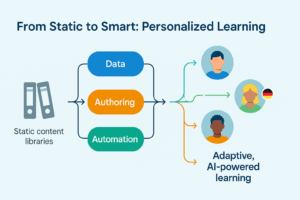
By Nick Etlar Eriksen From Static to Smart: Building an LMS Infrastructure for Truly Personalized Learning Everyone’s talking about personalized learning as if it were

By Eurekos Systems The Talented Learning Show with John Leh: Spotlight on Gencat and the Professional Driving Industry. You can drive a car. Does that
By Eurekos Systems Behind the Scenes: SmartStart Health’s CGM Training with Eurekos At Eurekos, we’re proud to support people with big ideas that make a

By Nick Etlar Eriksen Beyond Content: Why Advanced Facilitation Is Now the Core of Learning Strategy The other day, I overheard a CLO confidently say
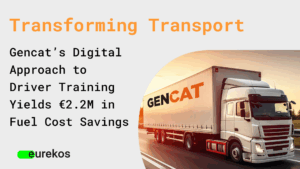
By Eurekos Systems Transforming Transport: Gencat’s Digital Approach to Driver Training Yields €2.2M in Fuel Cost Savings. The Gencat Case Study Irish transport compliance specialist

The Award Marks the Second Year In a Row Eurekos Has Been Honored by Talented Learning for Its Advanced Feature Set and Commitment to Innovation.

The company was named to Training Industry’s ‘2024 LMS Watch List’, recognizing Eurekos’ unique strengths and capabilities in the LMS market Copenhagen, Denmark –

6 Steps to Identifying the Skills Gaps in Your Organisation While researchers and executives often refer to skills gaps (or ‘shortages’ or ‘mismatches’), people may

By Vicky Kennedy, Echtus In the evolving landscape of customer education and enablement, the term “trained customer” has long been a standard. It’s rooted in

By Anders Willumsen In today’s competitive business world, standing out means providing top-notch customer experiences. While businesses usually focus on training their employees, shifting the

By John Leh Today’s Hot Take Review is about customer education LMS Eurekos. Unlike a lot of the other learning management systems we review, Eurekos

By Gordon Johnson The global pandemic led to a significant rise in the adoption of learning technologies. One area greatly impacted is educating customers and

By Nick Eriksen, Eurekos The world is once again abuzz with the excitement surrounding the latest tech breakthrough: Generative AI (Artificial Intelligence). Unlike many fleeting

By Anders Willumsen, Eurekos When it comes to finding an LMS that caters to customer education, there are six specific factors you should consider. These

The Sysmex Case Study: Transforming Customer Education In our case study, “Sysmex Reaches 100k+ Customers Worldwide with Transformational Product Training,” you’ll follow a remarkable journey

By Anders Willumsen Salience Learning builds a powerful blended learning program for lasting, life-saving change To help time-pressured pharmaceutical professionals improve their decision-making skills, Salience
By Gordon Johnson We are excited to announce that Nick Eriksen, a valued member of the Eurekos team, has been chosen to present at the
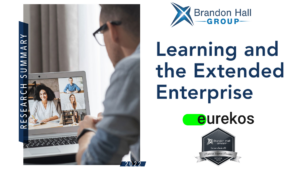
By Gordon Johnson “Great training can be the difference between satisfied and unhappy customers, or successful or ineffective sales partners,” Brandon Hall Group CEO Mike
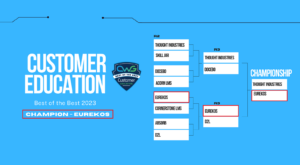
By Gordon Johnson It’s an indescribable honor for the Eurekos LMS to be picked as the top customer education system in the world! Thank you,

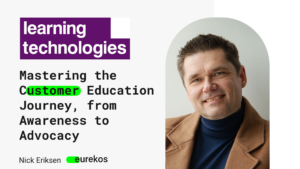
By Ken Joseph, Brandon Hall GroupEditor’s Note: This blog was originally published in January 2023 on the Brandon Hall blog. Mastering the Customer Education Journey

By Gordon Johnson The Customer Education Journey: Continuous, Engaging Product Training How do you use training to retain customers and expanding product usage? What are
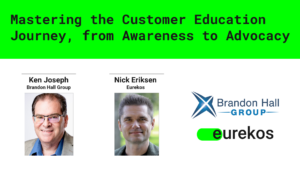
By Gordon Johnson Mastering the Customer Education Journey, from Awareness to Advocacy Most L&D professionals know a great customer education program can significantly reduce customer

By David Wentworth, Brandon Hall GroupEditor’s Note: This blog was originally published in January 2023 on the Brandon Hall blog. Bring Customers On Board at
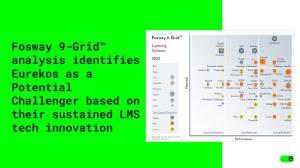
By Gordon Johnson, Eurekos Systems. Fosway 9-Grid™ analysis identifies Eurekos as a Potential Challenger based on sustained LMS tech innovation Copenhagen, Denmark, 26 January 2023

By Gordon Johnson, Eurekos Systems. Introducing Eurekos 11: New tools to deliver product training that increases customer retention Copenhagen, Denmark, 26 January 2023 — Eurekos

By Nick Eriksen, Eurekos Systems. Virtually every organization in the world has some sort of employee training program. Whether it’s leadership training, compliance, onboarding, personal

By Anders Willumsen, Eurekos Systems. Emphasize these 5 points when reviewing and changing your learning technology If you are looking to review and change your

By Soren Birch-Petersen, Eurekos Systems. Eurekos won a coveted Brandon Hall Group Bronze award alongside Sysmex Europe for excellence in the category ‘Best Customer Training Program’ with the entry

By Gordon Johnson, Eurekos Systems. Brandon Hall Group, the leader in Empowering, Recognizing and Certifying Excellence in HCM recently announced that Eurekos is certified as
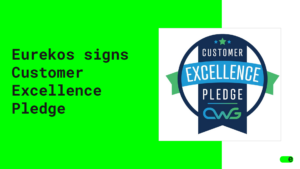
By Gordon Johnson, Eurekos Systems. Eurekos is one of a few, select LMS vendors that have signed the Customer Excellence Pledge, showing their commitment to

By Gordon Johnson, Eurekos Systems. The global corporate training market is expected to grow by $52.7 billion between 2020 and 2024. With progression at a

By Gordon Johnson, Eurekos Systems. We’re featured again on the Fosway 9-Grid™ for Learning Systems. It’s that time of the year. The time when Fosway, the
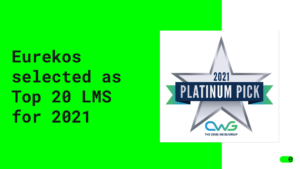
By Gordon Johnson, Eurekos Systems. Craig Weiss of Craig Weiss Group, elearninfo247.com and FindanLMS.com recently released his list of 2021 top 20 Learning Systems. Eurekos
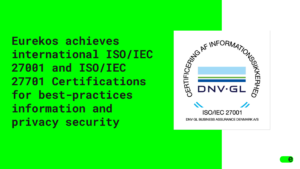
By Gordon Johnson, Eurekos Systems. Eurekos now offers the highest level of global information and privacy security, having achieved both ISO/IEC 27001 and ISO/IEC 27701

By Gordon Johnson, Eurekos Systems. As you continue to develop your eLearning content, there is a relatively untapped expert resource available and able to develop

By Patrycja Danylo, Eurekos Systems. For over 20 years, learning industry analysts have told us that eLearning and other types of self-paced learning will replace
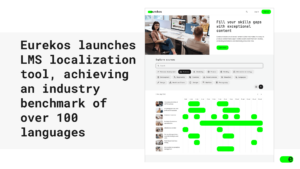
By Gordon Johnson, Eurekos Systems. Copenhagen, Denmark— Eurekos today announced the launch of a new language tool that will support over 100 languages in the

By Gordon Johnson, Eurekos Systems. Copenhagen, Denmark—Sysmex Europe and Eurekos, the developer of the Eurekos learning management system, won a coveted Brandon Hall Group silver
By Gordon Johnson, Eurekos Systems. Copenhagen, Denmark: Eurekos, the developer of the Eurekos learning management system, won an inaugural eLearning Industry Gold award for Design. “With
By Anna Stark, GoodFirms. Eurekos leads the way among the industry’s top LMS software and thrives on its 1stposition at GoodFirms for its excellent features

By Nick Eriksen, Eurekos Systems. Introducing a new perspective Countless studies have shown that e-learning/blended learning is almost in every case better than the traditional

By David Perring, Fosway Group Supercharge your organisation’s training with social and collaboration to make the learning memorable. Arguably, supporting people through behavioural change is

By Victor Putyata, Eurekos Systems. You already have much of the expertise you need to develop online learning content. Here is how the process works

By Max Petyurenko, Eurekos Systems. The use of internal experts, the right kind of learning management system and management commitment to building a learning culture

By David Patterson, Learning Light. Review of the Eurekos LMS, by David Patterson of Learning Light. “Eurekos has put an amazing level of thought and detail
By Gordon Johnson, Eurekos Systems. The experts from independent software review directory FinancesOnline announced today that they have granted their Great User Experience and Rising

By Gordon Johnson, Eurekos Systems. Delivering training to thousands of hospital staff on-the-go Challenge Sysmex needed to train hospital staff on their new instrument