
By Eurekos Systems
New Feature: Visual dashboards for Smarter Learning Insights
Welcome to The Eurekos Effect, where we highlight the latest updates designed to make your learning platform smarter, faster, and more impactful. Each post in this series explores a new feature—what it does, why it matters, and how it helps you deliver better training outcomes.
In today’s data-driven learning environment, numbers alone aren’t enough. You need analytics that turn raw data into actionable insights so you can improve learning outcomes, enhance engagement, and prove ROI. We have new visual dashboards to help you do just that.
Visual Dashboards: From Static Reports to Actionable Insights
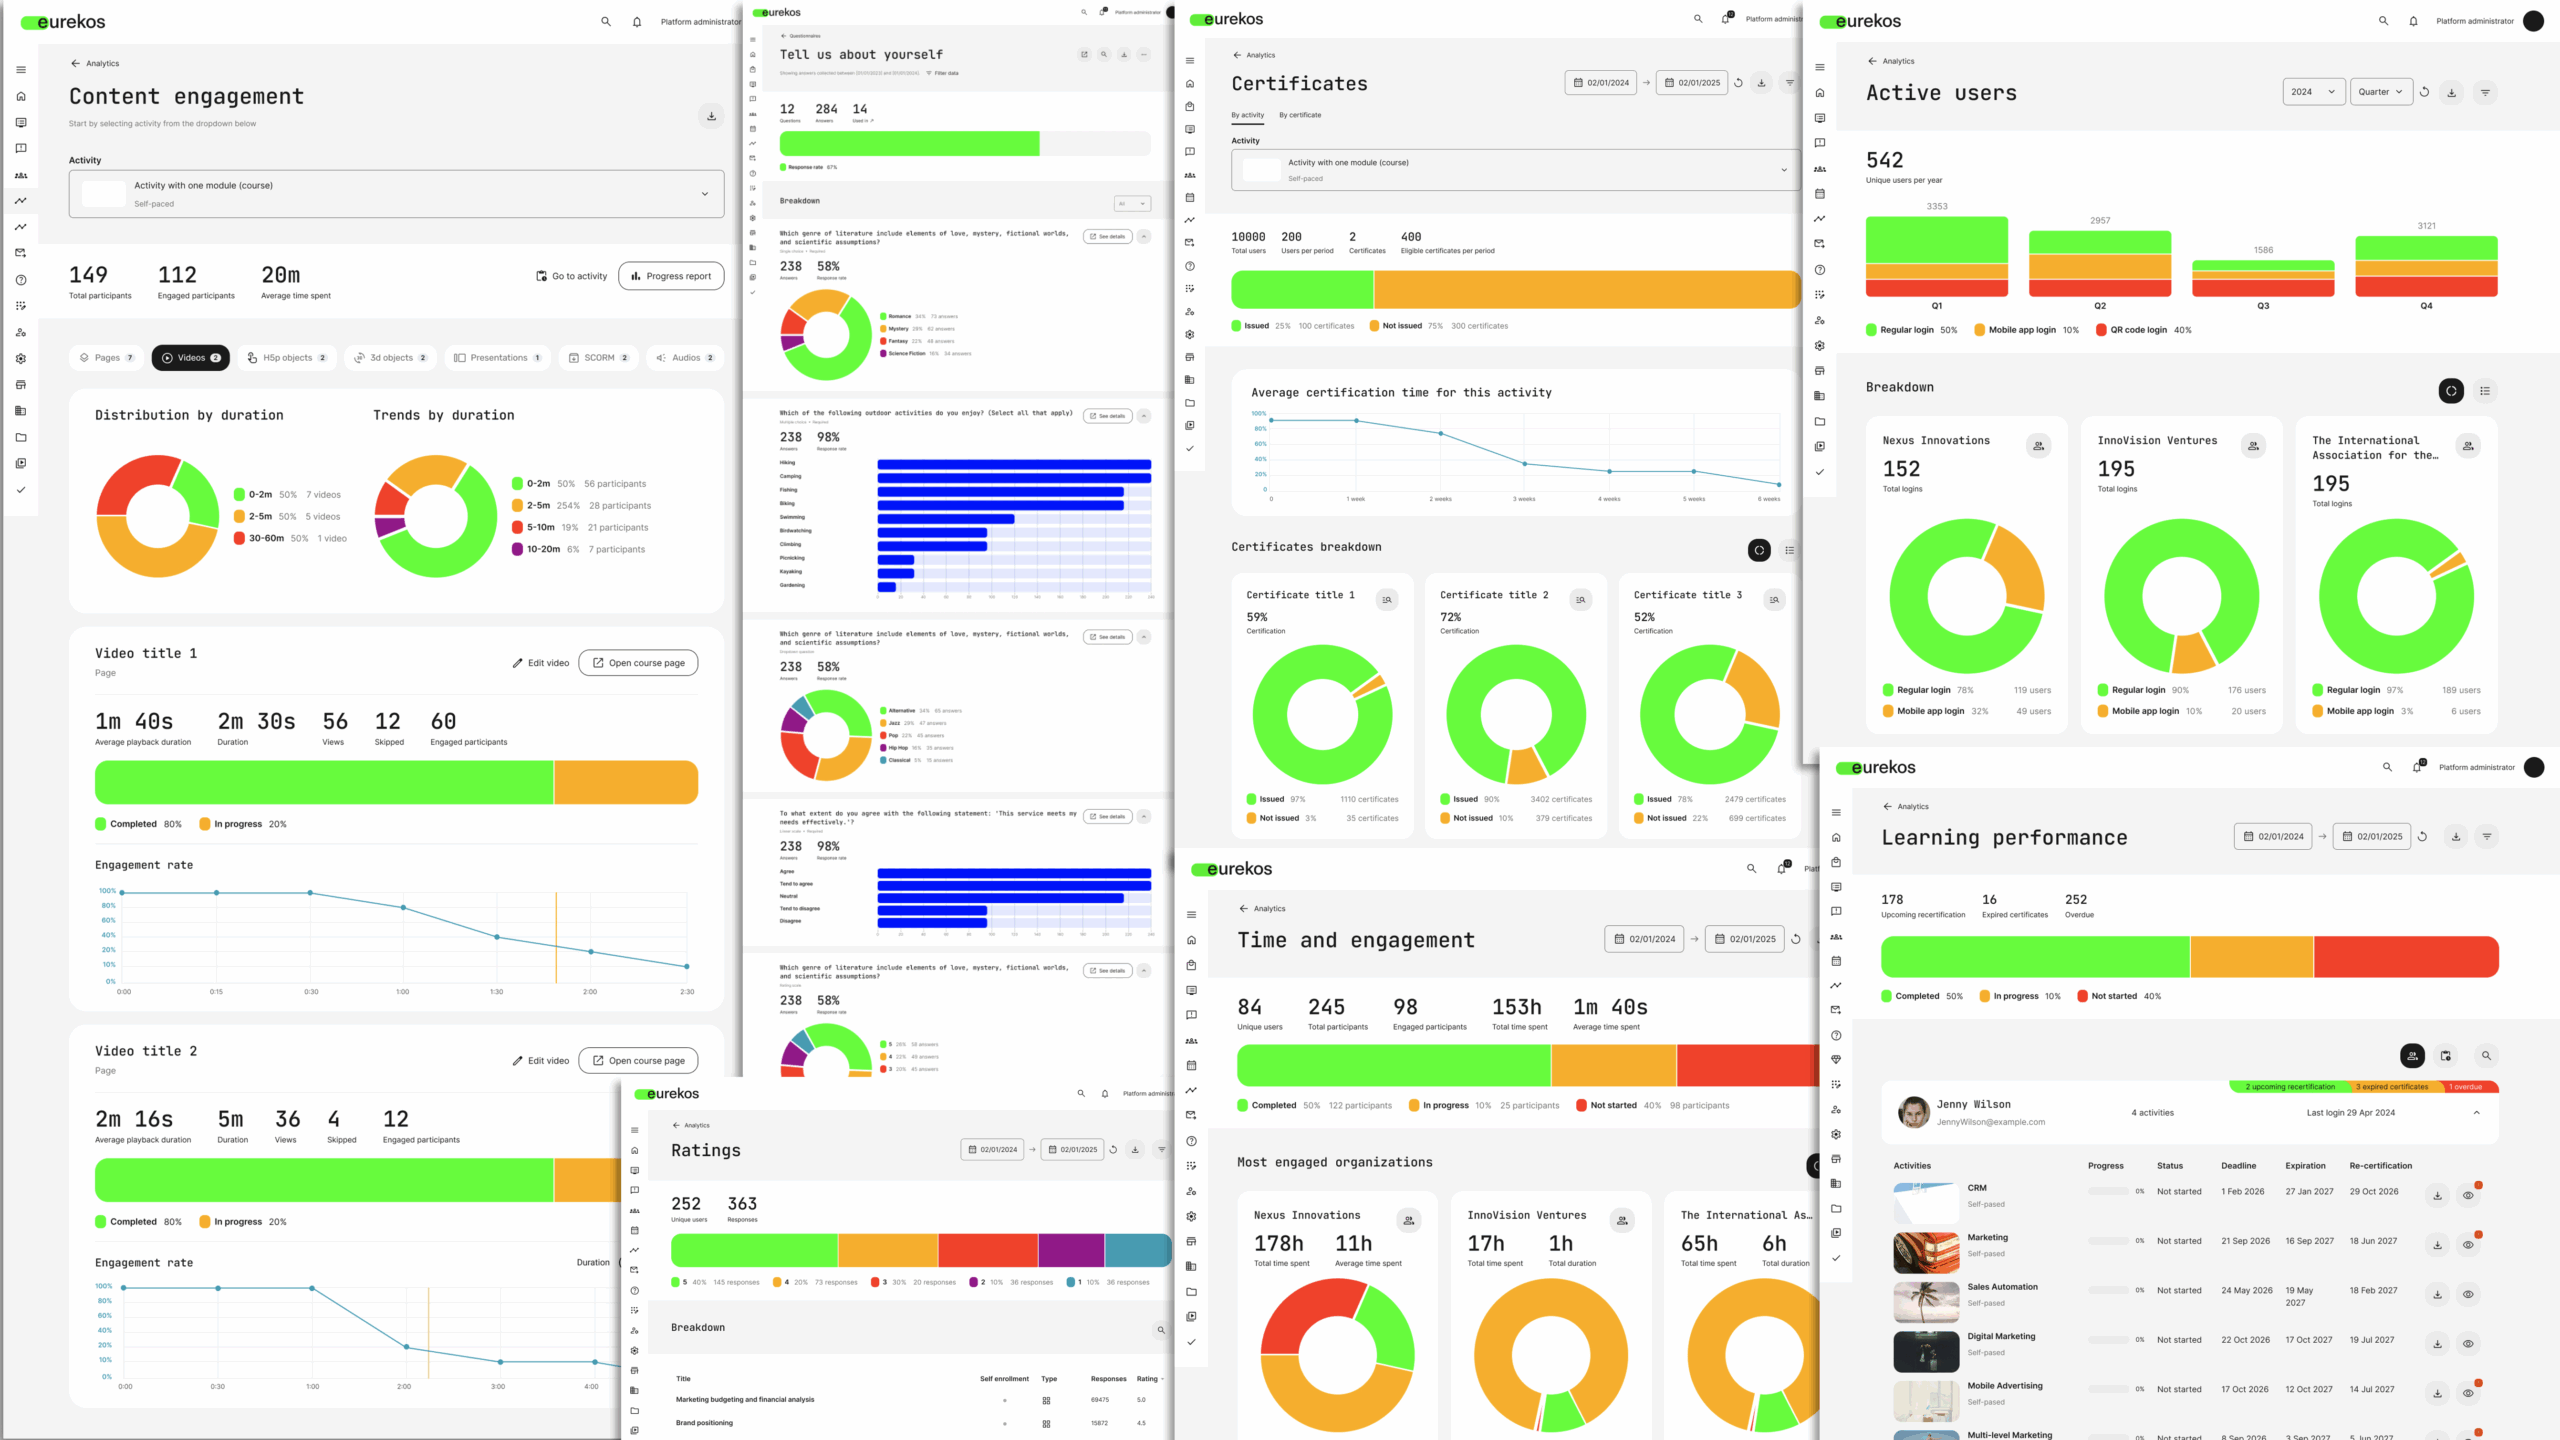
Traditional learning reports can be slow, hard to interpret, and often lack the depth needed for strategic decision-making. Our new dashboards transform reporting into dynamic, interactive intelligence—delivering business-level analytics out of the box.
With intuitive filters, powerful visuals, and tailored metrics, these dashboards give you clarity on what’s working, what needs improvement, and how learners are engaging across your training ecosystem.
What You Can Do with Visual Dashboards
With the new dashboards, you’re gaining enterprise-level insights that go far beyond basic completion rates. You can now:
- Monitor active users to understand adoption trends and engagement patterns
- Analyze questionnaires and ratings for learner feedback and course effectiveness
- Track content engagement to identify high-impact materials and opportunities for improvement
- Validate skills and progress through certificates and completion tracking
- Measure time & engagement to reveal learner behavior and activity patterns
- Evaluate learning performance for adaptive learning paths, skills management, and long-term outcomes
These dashboards combine operational metrics with strategic insights—giving you a complete view of learning performance and empowering continuous improvement.
Why It Matters
By transforming static reports into interactive, role-tailored dashboards, you:
Save time with instant insights
- Improve learner engagement and adoption
- Gain strategic clarity for decision-making
- Deliver measurable training impact
Final Thought
Our new Visual Dashboards aren’t just an upgrade—they’re a transformation in how you measure, understand, and improve learning.
Read another article about meta-analytics:
The Eurekos Effect: Analytics Permissions
The Eurekos Effect: Meta-Analytics Dashboards